The Exorcist: Believer (Universal Pictures)


Opened 10/6/2023 | Theatrical • Wide (3,684 locations)
Technical Specs: Auro 11.1
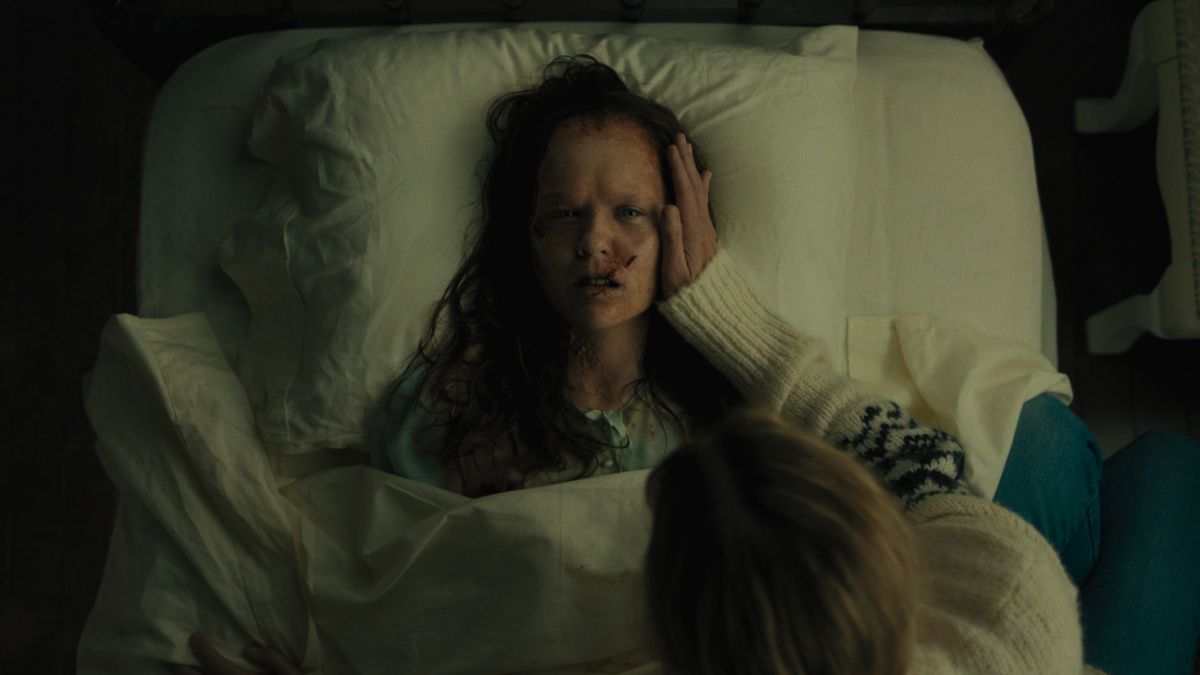
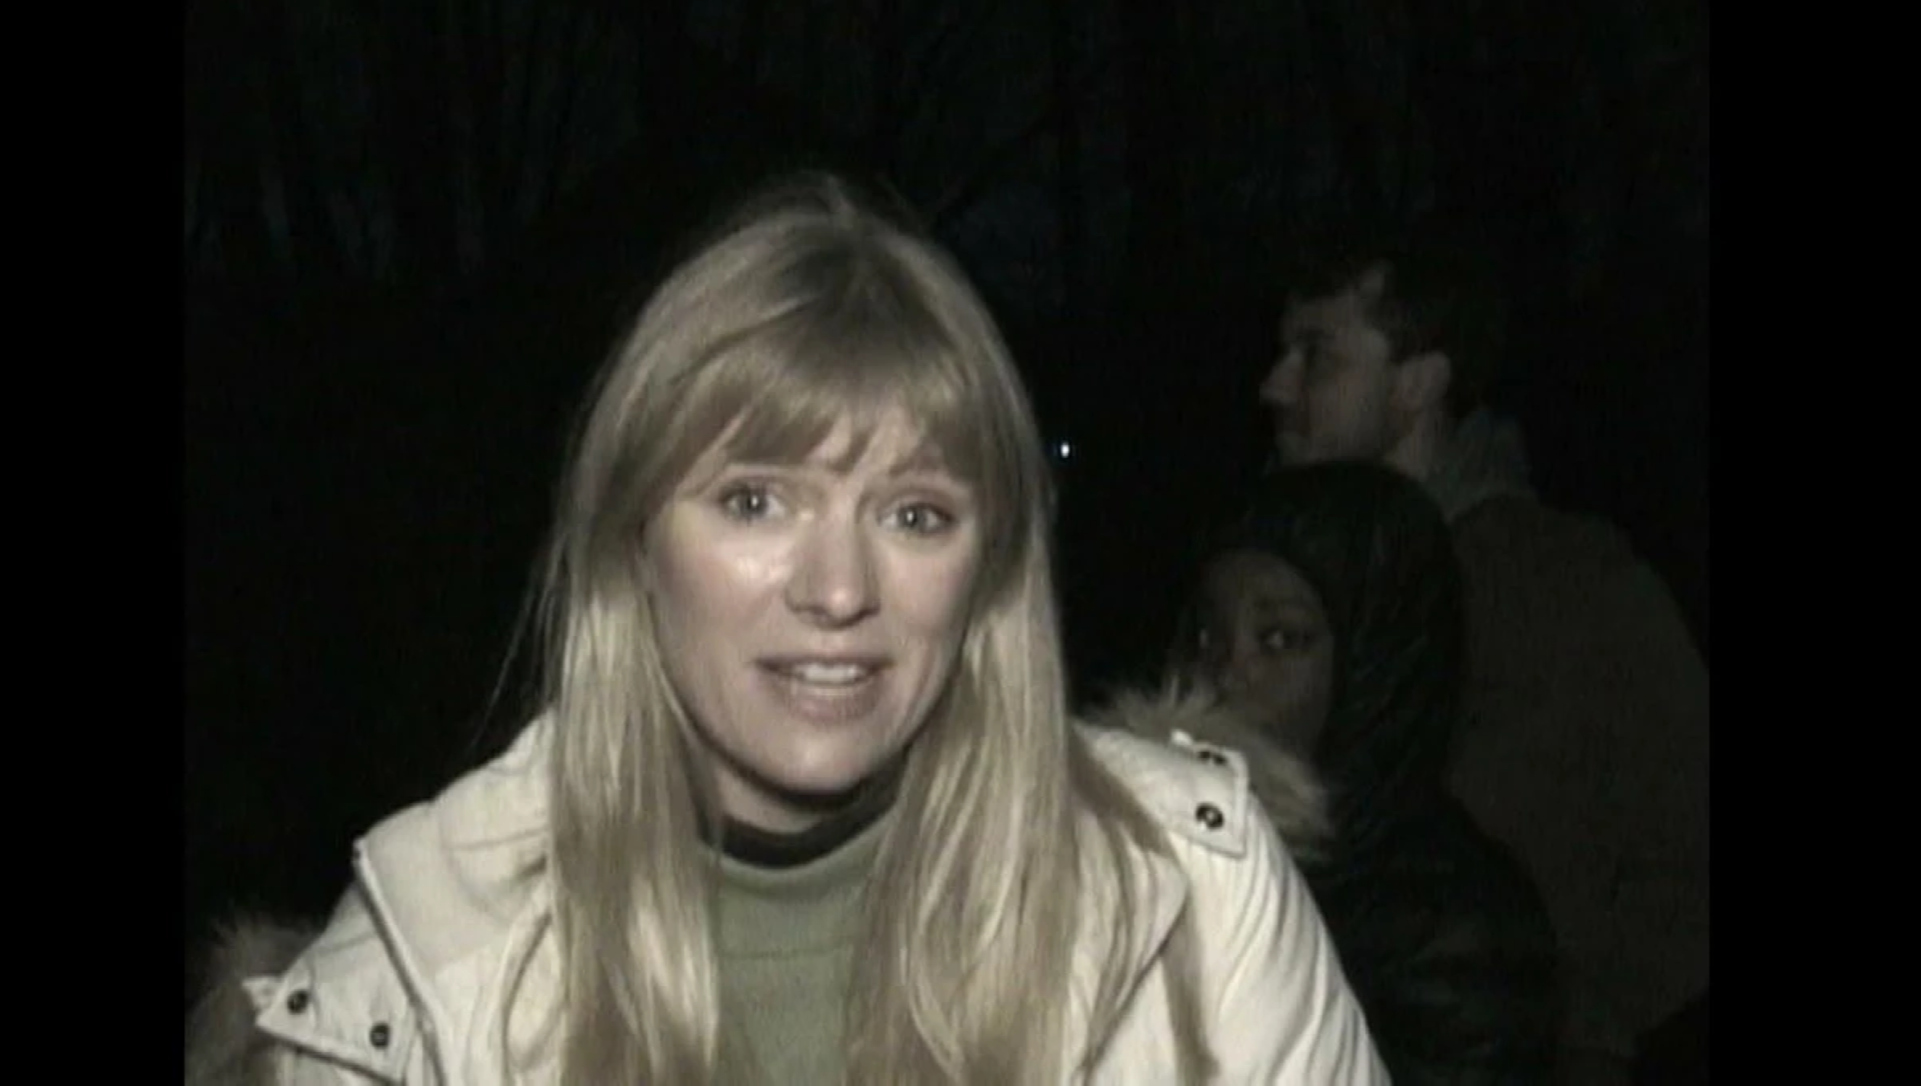
When two girls disappear into the woods and return three days later with no memory of what happened to them, the father of one girl seeks out Chris MacNeil, who's been forever altered by what happened to her daughter fifty years ago.
Director & Top Cast

David Gordon Green
Director
Box Office Results
Domestic
| Week 1 10/06-10/12 | Week 2 10/13-10/19 | Week 3 10/20-10/26 | Week 4 10/27-11/02 | Week 5 11/03-11/09 | Week 6 11/10-11/16 | Week 7-8 11/17-11/24 |
||||
|---|---|---|---|---|---|---|---|---|---|---|
| weekend | 26497600 | 10979750 | 5698965 | 3261775 | 2106655 | 1145000 | 152500 | |||
| cume | 33926950 | 48601950 | 56265830 | 61004670 | 63844335 | 65336375 | 65537395 | 65509850 | 65537395 | 65537395 |
[bsa_pro_ad_space id=13]
| Weekend | Weekly | Locations | |||||
|---|---|---|---|---|---|---|---|
| Week | Gross $ | % Chg. | Gross $ | % Chg. | # | Chg. | Per Theater Average |
| 1 | 10/6/2023-10/12/2023 | $26,497,600 | - | $33,926,950 | - | 3,663 | - | $9,262 |
| 2 | 10/13/2023-10/19/2023 | $10,979,750 | -58.6 % | $14,675,000 | -56.7 % | 3,684 | 21 | $3,983 |
| 3 | 10/20/2023-10/26/2023 | $5,698,965 | -48.1 % | $7,663,880 | -47.8 % | 3,323 | -361 | $2,306 |
| 4 | 10/27/2023-11/2/2023 | $3,261,775 | -42.8 % | $4,738,840 | -38.2 % | 2,717 | -606 | $1,744 |
| 5 | 11/3/2023-11/9/2023 | $2,106,655 | -35.4 % | $2,839,665 | -40.1 % | 2,429 | -288 | $1,169 |
| 6 | 11/10/2023-11/16/2023 | $1,145,000 | -45.6 % | $1,492,040 | -47.5 % | 1,587 | -842 | $940 |
| 7 | 11/17/2023-11/23/2023 | $130,315 | -88.6 % | $173,475 | -88.4 % | 295 | -1,292 | $588 |
| 8 | 11/24/2023-11/30/2023 | $22,185 | -83 % | $27,545 | -84.1 % | 35 | -260 | $787 |
| Total | $65,537,395 | ||||||
Total Includes Full Week Grosses for Weeks 1-8
Worldwide
Box Office Results
| Domestic Total | International Total | Worldwide Total |
|---|---|---|
| $65,537,395 (48%) | $70,721,213 (52%) | $136,498,027 (100%) |