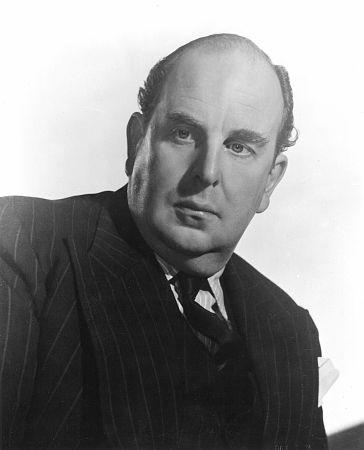
Director & Top Cast
Dror Moreh
Director
Robert Morley
Doctor Percival
Box Office Results
Domestic
| Week 1 05/07-05/13 | Week 2 05/14-05/20 | Week 3 05/21-05/27 |
|
|---|---|---|---|
| weekend | 15549 | 6684 | 1312 |
| cume | 25171 | 33673 | 35570 |
[bsa_pro_ad_space id=13]
| Weekend | Weekly | Locations | |||||
|---|---|---|---|---|---|---|---|
| Week | Gross $ | % Chg. | Gross $ | % Chg. | # | Chg. | Per Theater Average |
| 1 | 5/7/2021-5/13/2021 | $15,549 | - | $25,171 | - | 90 | - | $280 |
| 2 | 5/14/2021-5/20/2021 | $6,684 | -57 % | $8,502 | -66.2 % | 55 | -35 | $155 |
| 3 | 5/21/2021-5/27/2021 | $1,312 | -80.4 % | $1,897 | -77.7 % | 12 | -43 | $158 |
| Total | $35,570 | ||||||
Total Includes Full Week Grosses for Weeks 1-3
Worldwide
Box Office Results
| Domestic Total | International Total | Worldwide Total |
|---|---|---|
| $36,693 (85.7%) | $6,119 (14.3%) | $42,812 (100%) |


