Django Unchained (The Weinstein Company)


Opened 12/25/2012 | Theatrical • Wide (3,012 locations)
Technical Specs: SDDS,Datasat,Dolby Digital
With the help of a German bounty-hunter, a freed slave sets out to rescue his wife from a brutal plantation owner in Mississippi.

Director & Top Cast

Quentin Tarantino
Director

Jamie Foxx
Django

Christoph Waltz
Dr. King Schultz

Leonardo DiCaprio
Calvin Candie

Kerry Washington
Broomhilda von Shaft

Samuel L. Jackson
Stephen

Walton Goggins
Billy Crash
Dennis Christopher
Leonide Moguy

James Remar
Butch Pooch
David Steen
Mr. Stonesipher
Dana Gourrier
Cora
Nichole Galicia
Sheba
Laura Cayouette
Lara Lee Candie-Fitzwilly
Ato Essandoh
D'Artagnan
Sammi Rotibi
Rodney
Clay Donahue Fontenot
Big Fred's Opponent

Escalante Lundy
Big Fred
Miriam F. Glover
Betina
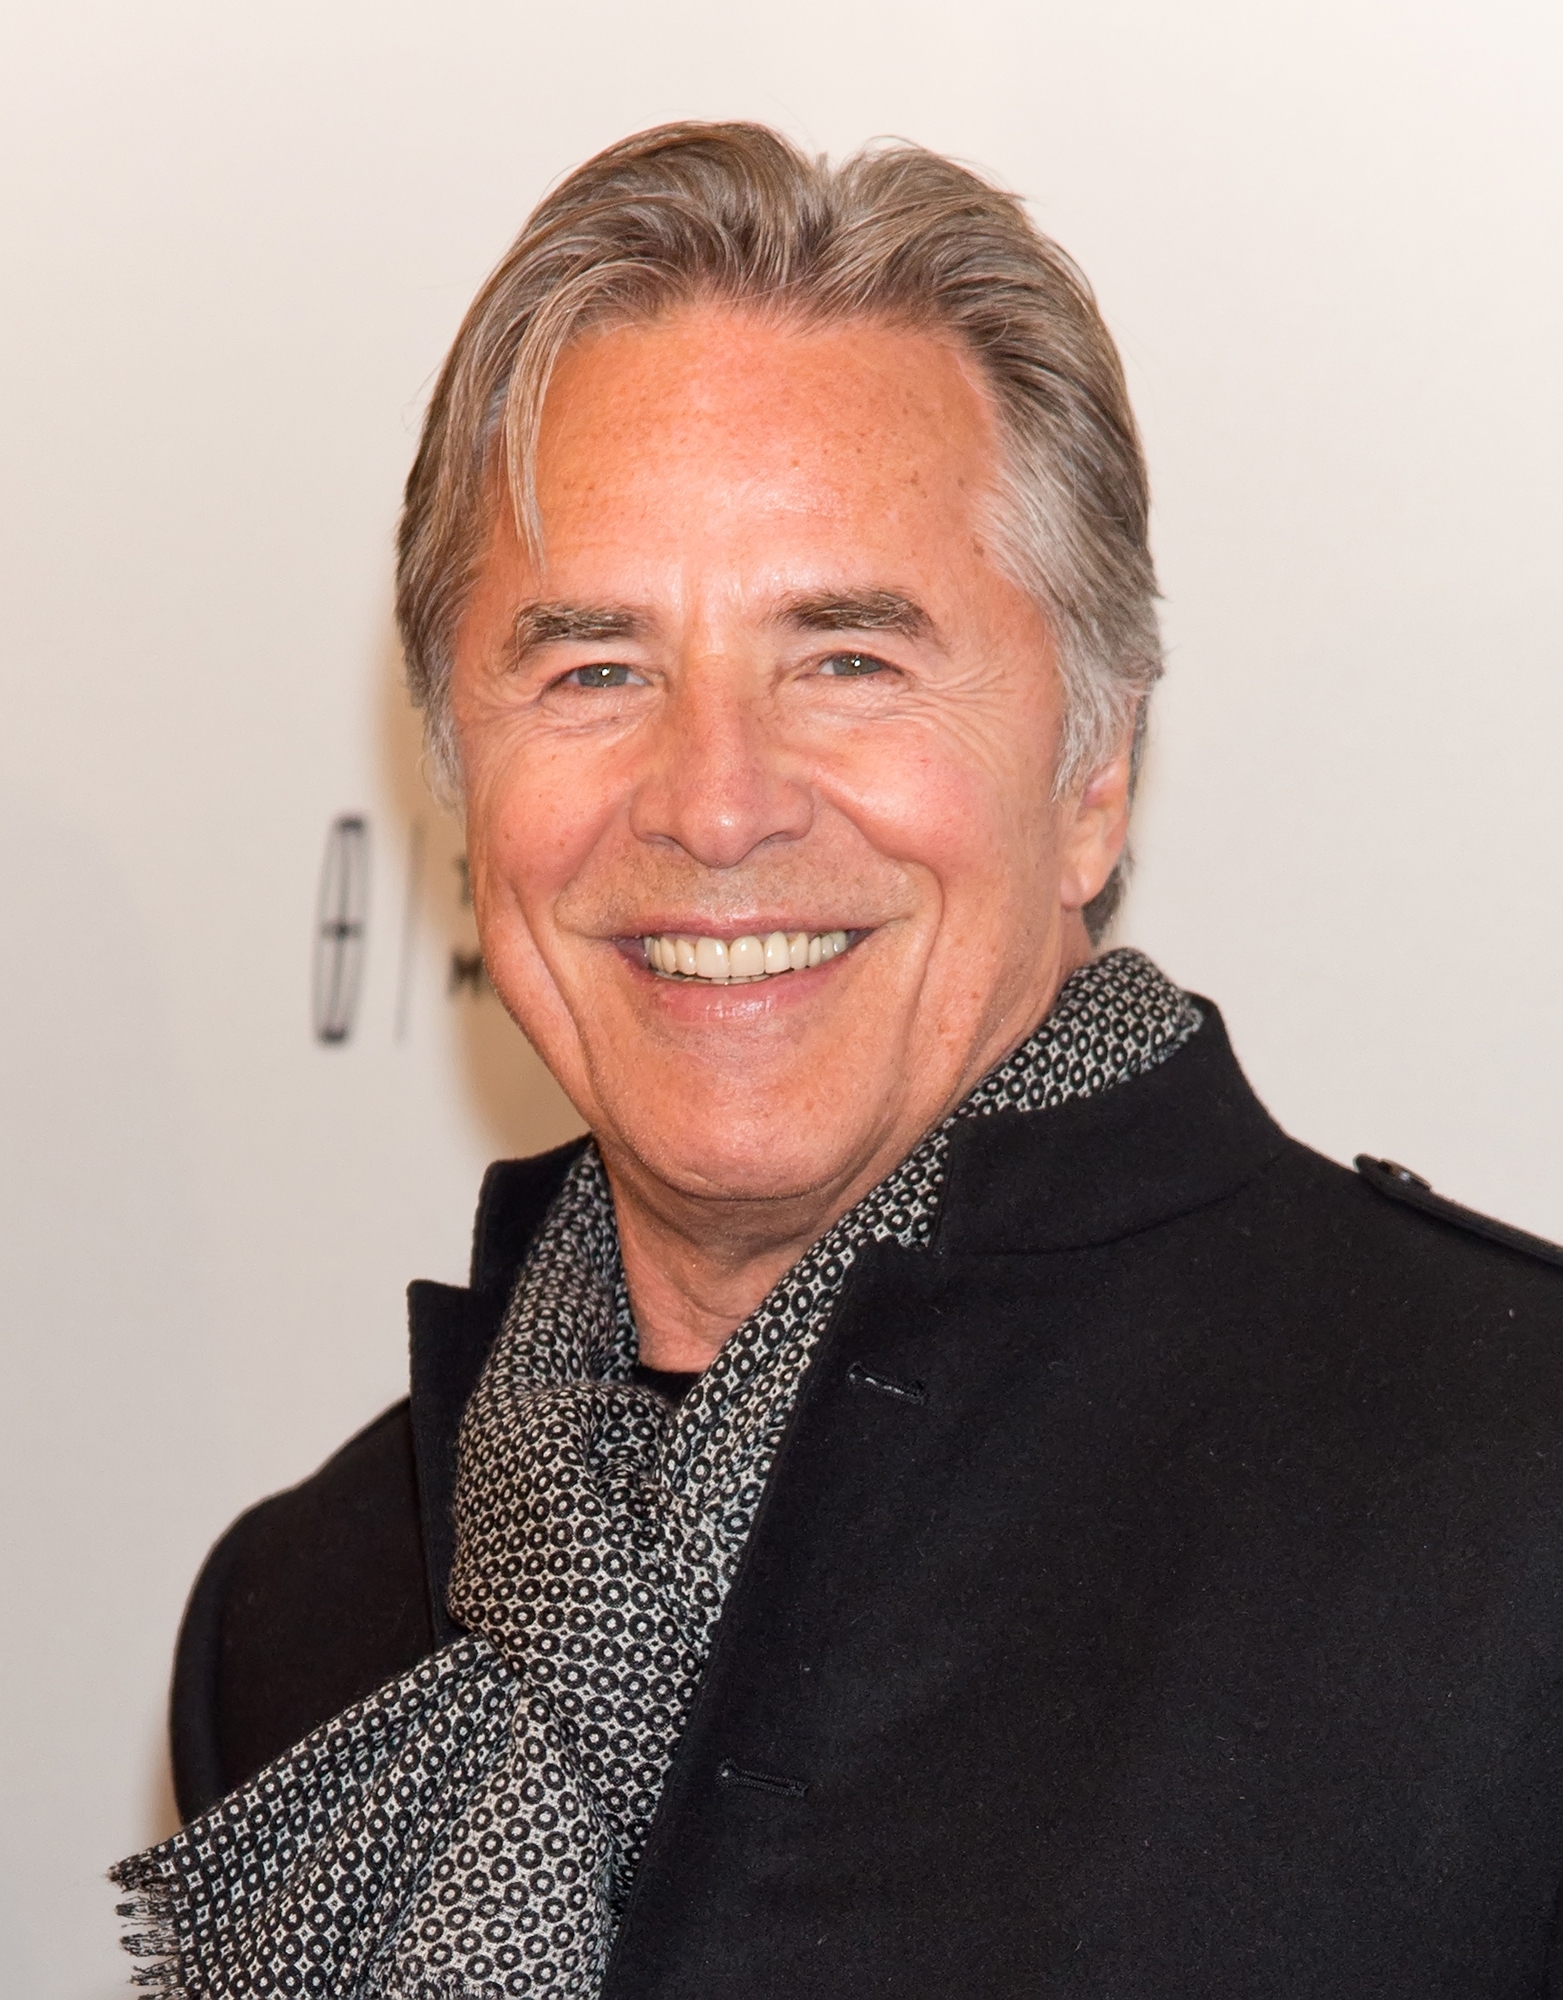
Don Johnson
Big Daddy
Box Office Results
Domestic
| Week 1 12/21-12/27 | Week 2 12/28-01/03 | Week 3 01/04-01/10 | Week 4 01/11-01/17 | Week 5 01/18-01/24 | Week 6 01/25-01/31 | Week 7-21 2/1-5/10 |
||||||||||||||||||||||||||||||
|---|---|---|---|---|---|---|---|---|---|---|---|---|---|---|---|---|---|---|---|---|---|---|---|---|---|---|---|---|---|---|---|---|---|---|---|---|
| weekend | 0 | 30122888 | 20010745 | 11040485 | 7755800 | 4946932 | 10230668 | |||||||||||||||||||||||||||||
| cume | 33320265 | 86269377 | 114334122 | 130118735 | 141289826 | 147940189 | 162805434 | 152213132 | 162805434 | 155492983 | 162805434 | 157811775 | 162805434 | 159292007 | 162805434 | 160668452 | 162805434 | 161300527 | 162805434 | 161723816 | 162805434 | 162142813 | 162805434 | 162411305 | 162805434 | 162610444 | 162805434 | 162721647 | 162805434 | 162774772 | 162805434 | 162796047 | 162805434 | 162803114 | 162805434 | 162805434 |
[bsa_pro_ad_space id=13]
| Weekend | Weekly | Locations | |||||
|---|---|---|---|---|---|---|---|
| Week | Gross $ | % Chg. | Gross $ | % Chg. | # | Chg. | Per Theater Average |
| 1 | 12/21/2012-12/27/2012 | $0 | - | $33,320,265 | - | 3,010 | - | $11,070 |
| 2 | 12/28/2012-1/3/2013 | $30,122,888 | 0 % | $52,949,112 | 58.9 % | 3,010 | 0 | $17,591 |
| 3 | 1/4/2013-1/10/2013 | $20,010,745 | -33.6 % | $28,064,745 | -47 % | 3,010 | 0 | $9,324 |
| 4 | 1/11/2013-1/17/2013 | $11,040,485 | -44.8 % | $15,784,613 | -43.8 % | 3,012 | 2 | $5,241 |
| 5 | 1/18/2013-1/24/2013 | $7,755,800 | -29.8 % | $11,171,091 | -29.2 % | 2,516 | -496 | $4,440 |
| 6 | 1/25/2013-1/31/2013 | $4,946,932 | -36.2 % | $6,650,363 | -40.5 % | 2,007 | -509 | $3,314 |
| 7 | 2/1/2013-2/7/2013 | $3,002,769 | -39.3 % | $4,272,943 | -35.7 % | 1,777 | -230 | $2,405 |
| 8 | 2/8/2013-2/14/2013 | $2,303,495 | -23.3 % | $3,279,851 | -23.2 % | 1,408 | -369 | $2,329 |
| 9 | 2/15/2013-2/21/2013 | $1,527,281 | -33.7 % | $2,318,792 | -29.3 % | 1,017 | -391 | $2,280 |
| 10 | 2/22/2013-2/28/2013 | $971,655 | -36.4 % | $1,480,232 | -36.2 % | 659 | -358 | $2,246 |
| 11 | 3/1/2013-3/7/2013 | $976,930 | 0.5 % | $1,376,445 | -7 % | 983 | 324 | $1,400 |
| 12 | 3/8/2013-3/14/2013 | $432,074 | -55.8 % | $632,075 | -54.1 % | 336 | -647 | $1,881 |
| 13 | 3/15/2013-3/21/2013 | $282,744 | -34.6 % | $423,289 | -33 % | 266 | -70 | $1,591 |
| 14 | 3/22/2013-3/28/2013 | $283,619 | 0.3 % | $418,997 | -1 % | 296 | 30 | $1,416 |
| 15 | 3/29/2013-4/4/2013 | $171,870 | -39.4 % | $268,492 | -35.9 % | 233 | -63 | $1,152 |
| 16 | 4/5/2013-4/11/2013 | $137,857 | -19.8 % | $199,139 | -25.8 % | 183 | -50 | $1,088 |
| 17 | 4/12/2013-4/18/2013 | $81,138 | -41.1 % | $111,203 | -44.2 % | 126 | -57 | $883 |
| 18 | 4/19/2013-4/25/2013 | $38,609 | -52.4 % | $53,125 | -52.2 % | 77 | -49 | $690 |
| 19 | 4/26/2013-5/2/2013 | $14,660 | -62 % | $21,275 | -60 % | 38 | -39 | $560 |
| 20 | 5/3/2013-5/9/2013 | $4,433 | -69.8 % | $7,067 | -66.8 % | 12 | -26 | $589 |
| 21 | 5/10/2013-5/16/2013 | $1,534 | -65.4 % | $2,320 | -67.2 % | 5 | -7 | $464 |
| Total | $162,805,434 | ||||||
Total Includes Full Week Grosses for Weeks 1-21
Worldwide
Box Office Results
| Domestic Total | International Total | Worldwide Total |
|---|---|---|
| $162,805,434 (38.2%) | $263,268,939 (61.8%) | $426,076,293 (100%) |