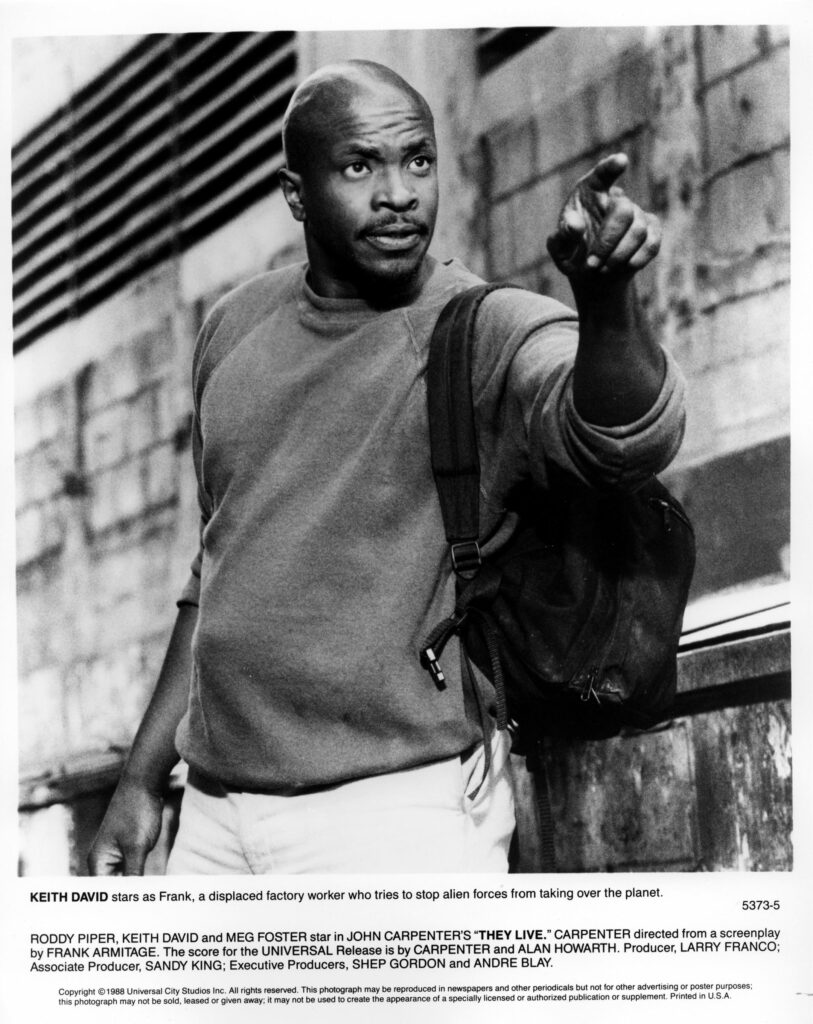
Director & Top Cast
John Carpenter
Director
Peter Jason
Gilbert
Box Office Results
Domestic
| Week 1 11/11-11/17 | Week 2 11/18-11/24 | Week 3 11/25-12/01 | Week 4 12/02-12/08 | Week 5 12/15-12/21 |
|
|---|---|---|---|---|---|
| weekend | 4827903 | 2772100 | 1296415 | 679770 | 0 |
| cume | 6216803 | 9696518 | 11570453 | 12250223 | 12689273 |
[bsa_pro_ad_space id=13]
| Weekend | Weekly | Locations | |||||
|---|---|---|---|---|---|---|---|
| Week | Gross $ | % Chg. | Gross $ | % Chg. | # | Chg. | Per Theater Average |
| 1 | 11/11/1988-11/17/1988 | $4,827,903 | - | $6,216,803 | - | 1,463 | - | $4,249 |
| 2 | 11/18/1988-11/24/1988 | $2,772,100 | -42.6 % | $3,479,715 | -44 % | 1,459 | -4 | $2,385 |
| 3 | 11/25/1988-12/1/1988 | $1,296,415 | -53.2 % | $1,873,935 | -46.1 % | 1,033 | -426 | $1,814 |
| 4 | 12/2/1988-12/8/1988 | $679,770 | -47.6 % | $679,770 | -63.7 % | 581 | -452 | $1,170 |
| 5 | 12/15/2023-12/21/2023 | $0 | -100 % | $439,050 | -35.4 % | -581 | - | |
| Total | $12,689,273 | ||||||
Total Includes Full Week Grosses for Weeks 1-5
Worldwide
Box Office Results
| Domestic Total | International Total | Worldwide Total |
|---|---|---|
| $13,447,978 (100%) | $1,160 (0%) | $13,450,603 (100%) |


