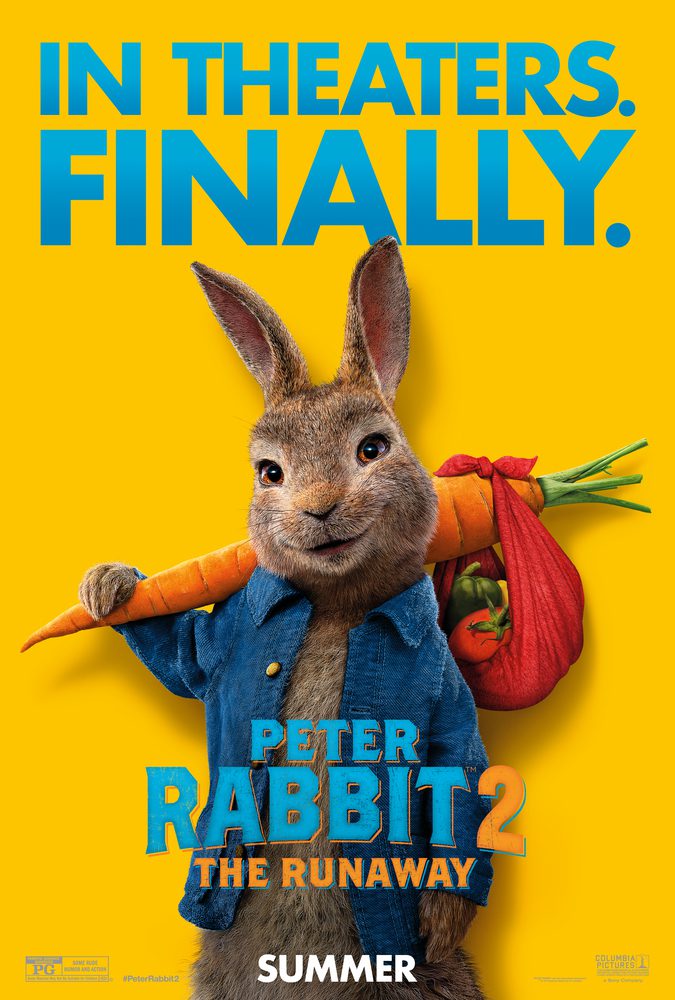
Peter Rabbit 2: The Runaway (Sony Pictures Entertainment (SPE))


Opened 6/11/2021 | Theatrical • Wide (3,346 locations)
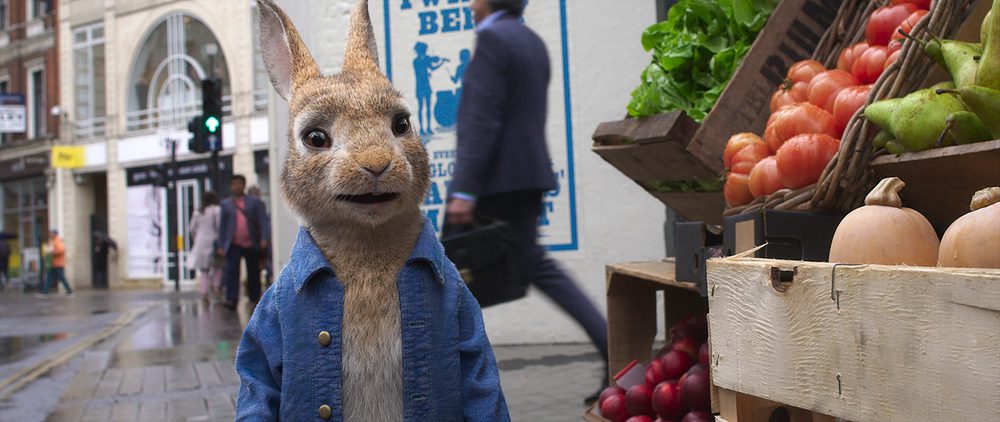
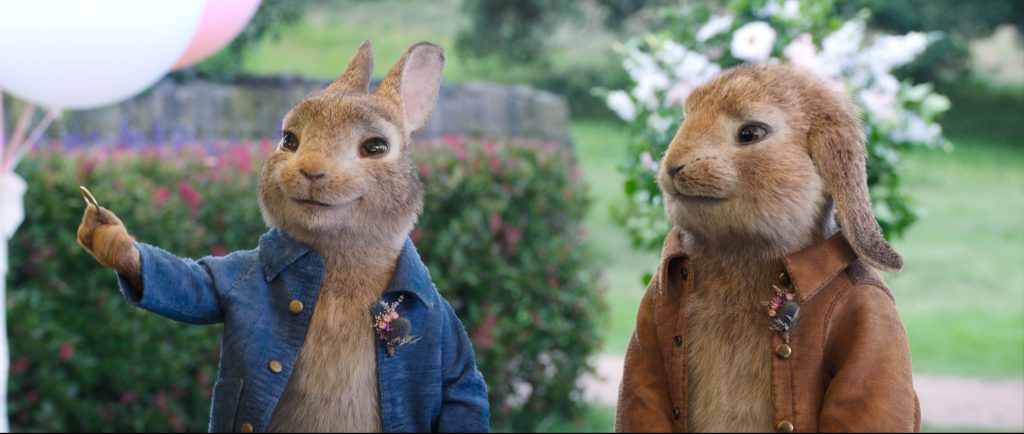
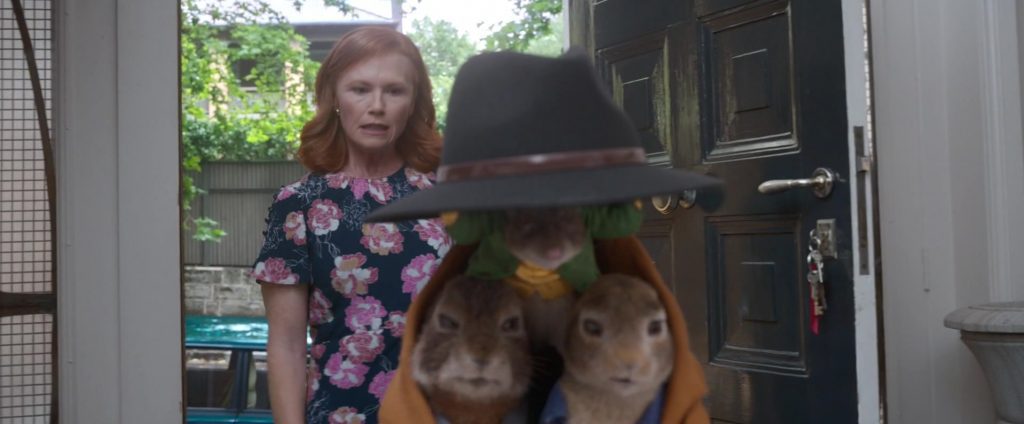
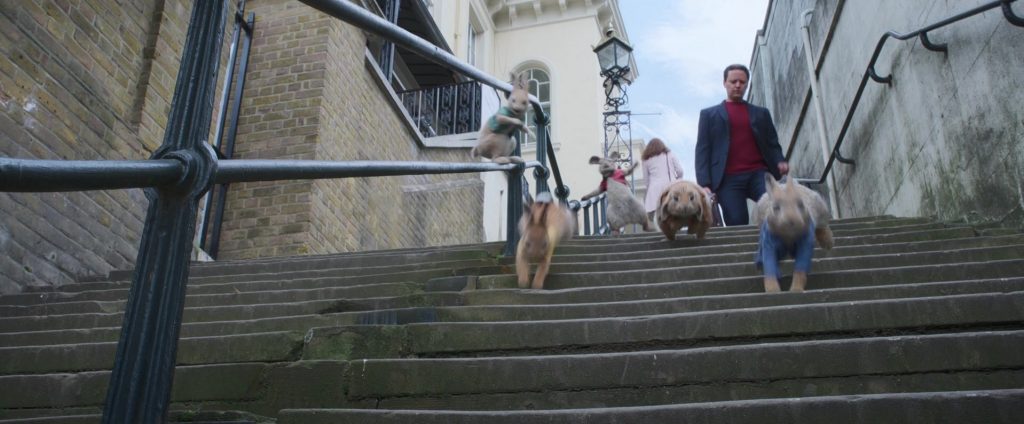
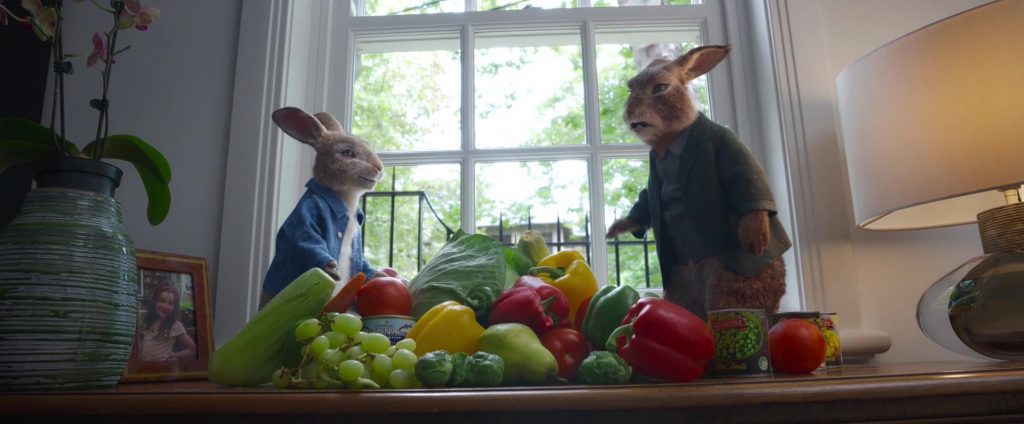
Thomas and Bea are now married and living with Peter and his rabbit family. Bored of life in the garden, Peter goes to the big city, where he meets shady characters and ends up creating chaos for the whole family.
Buy for $14.99Partnered With 
Director & Top Cast

Will Gluck
Director
Madeleine Wilson
art_department
Box Office Results
Domestic
| Week 1 06/11-06/17 | Week 2 06/18-06/24 | Week 3 06/25-07/01 | Week 4 07/02-07/08 | Week 5 07/09-07/15 | Week 6 07/16-07/22 | Week 7-9 7/30-8/13 |
||||||
|---|---|---|---|---|---|---|---|---|---|---|---|---|
| weekend | 10101066 | 6081764 | 4772230 | 2189910 | 1262805 | 613490 | 411172 | |||||
| cume | 14225283 | 24005098 | 32166482 | 36450004 | 38692319 | 39735880 | 40336536 | 40190829 | 40336536 | 40275345 | 40336536 | 40336536 |
[bsa_pro_ad_space id=13]
| Weekend | Weekly | Locations | |||||
|---|---|---|---|---|---|---|---|
| Week | Gross $ | % Chg. | Gross $ | % Chg. | # | Chg. | Per Theater Average |
| 1 | 6/11/2021-6/17/2021 | $10,101,066 | - | $14,225,283 | - | 3,346 | - | $4,251 |
| 2 | 6/18/2021-6/24/2021 | $6,081,764 | -39.8 % | $9,779,815 | -31.3 % | 3,346 | 0 | $2,923 |
| 3 | 6/25/2021-7/1/2021 | $4,772,230 | -21.5 % | $8,161,384 | -16.5 % | 3,331 | -15 | $2,450 |
| 4 | 7/2/2021-7/8/2021 | $2,189,910 | -54.1 % | $4,283,522 | -47.5 % | 2,954 | -377 | $1,450 |
| 5 | 7/9/2021-7/15/2021 | $1,262,805 | -42.3 % | $2,242,315 | -47.7 % | 1,958 | -996 | $1,145 |
| 6 | 7/16/2021-7/22/2021 | $613,490 | -51.4 % | $1,043,561 | -53.5 % | 1,117 | -841 | $934 |
| 7 | 7/23/2021-7/29/2021 | $265,465 | -56.7 % | $454,949 | -56.4 % | 578 | -539 | $787 |
| 8 | 7/30/2021-8/5/2021 | $84,516 | -68.2 % | $84,516 | -81.4 % | 180 | -398 | $470 |
| 9 | 8/6/2021-8/12/2021 | $61,191 | -27.6 % | $61,191 | -27.6 % | 119 | -61 | $514 |
| Total | $40,336,536 | ||||||
Total Includes Full Week Grosses for Weeks 1-9
Worldwide
Box Office Results
| Domestic Total | International Total | Worldwide Total |
|---|---|---|
| $40,501,717 (26%) | $113,400,000 (74%) | $155,529,154 (100%) |
Photos