The Shape of Water (Fox Searchlight Pictures)


Opened 12/1/2017 | Theatrical • Wide (2,341 locations)
Technical Specs: Dolby Digital,DTS
At a top secret research facility in the 1960s, a lonely janitor forms a unique relationship with an amphibious creature that is being held in captivity.
Director & Top Cast

Guillermo del Toro
Director

Sally Hawkins
Elisa Esposito

Octavia Spencer
Zelda Fuller

Michael Shannon
Richard Strickland

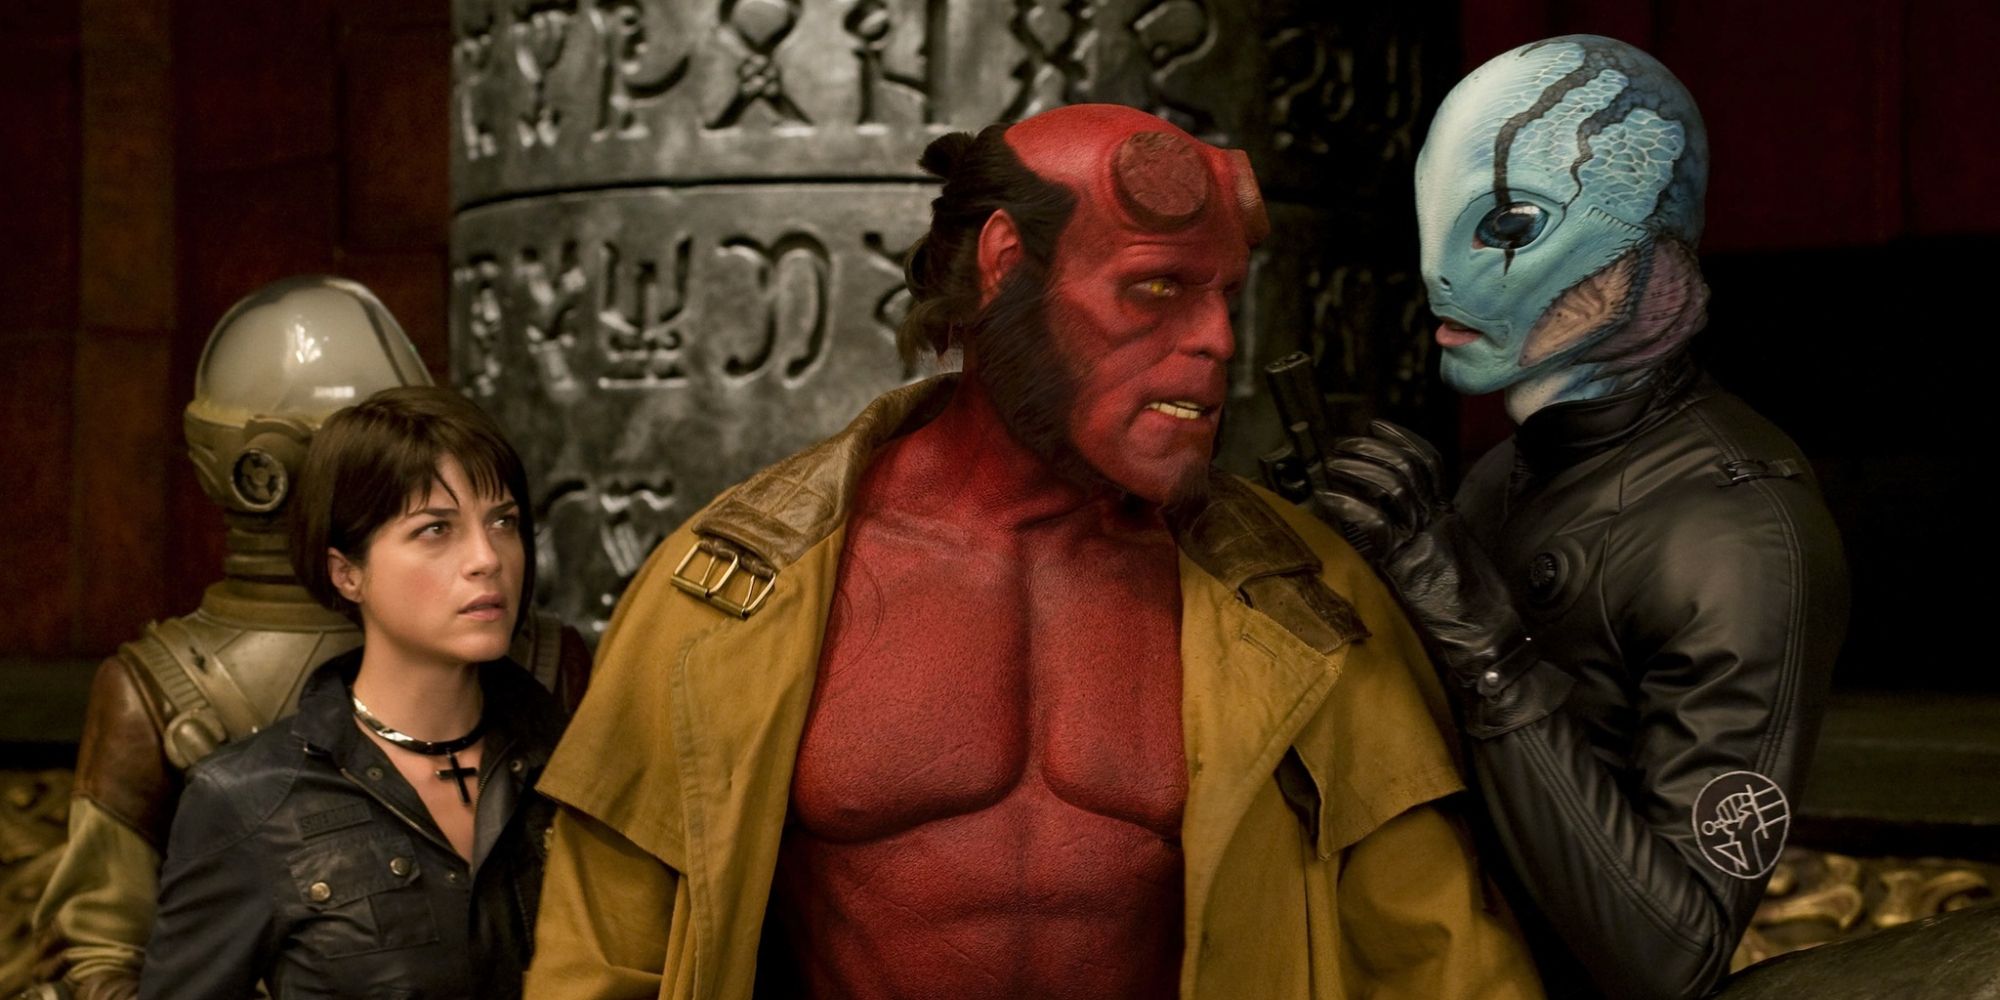
Doug Jones
Amphibian Man
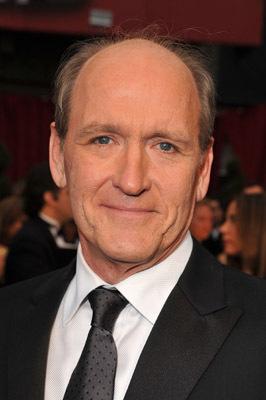
Richard Jenkins
Giles

Michael Stuhlbarg
Dr. Robert Hoffstetler

David Hewlett
Fleming

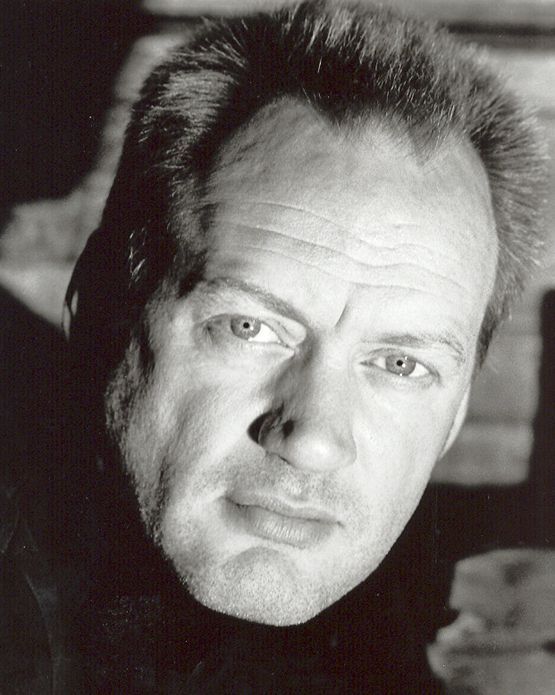
Nick Searcy
General Hoyt

Stewart Arnott
Bernard
Nigel Bennett
Mihalkov

Lauren Lee Smith
Elaine Strickland
Martin Roach
Brewster Fuller

Allegra Fulton
Yolanda

John Kapelos
Mr. Arzoumanian
Morgan Kelly
Pie Guy
Marvin Kaye
Burly Russian

Dru Viergever
Military Policeman
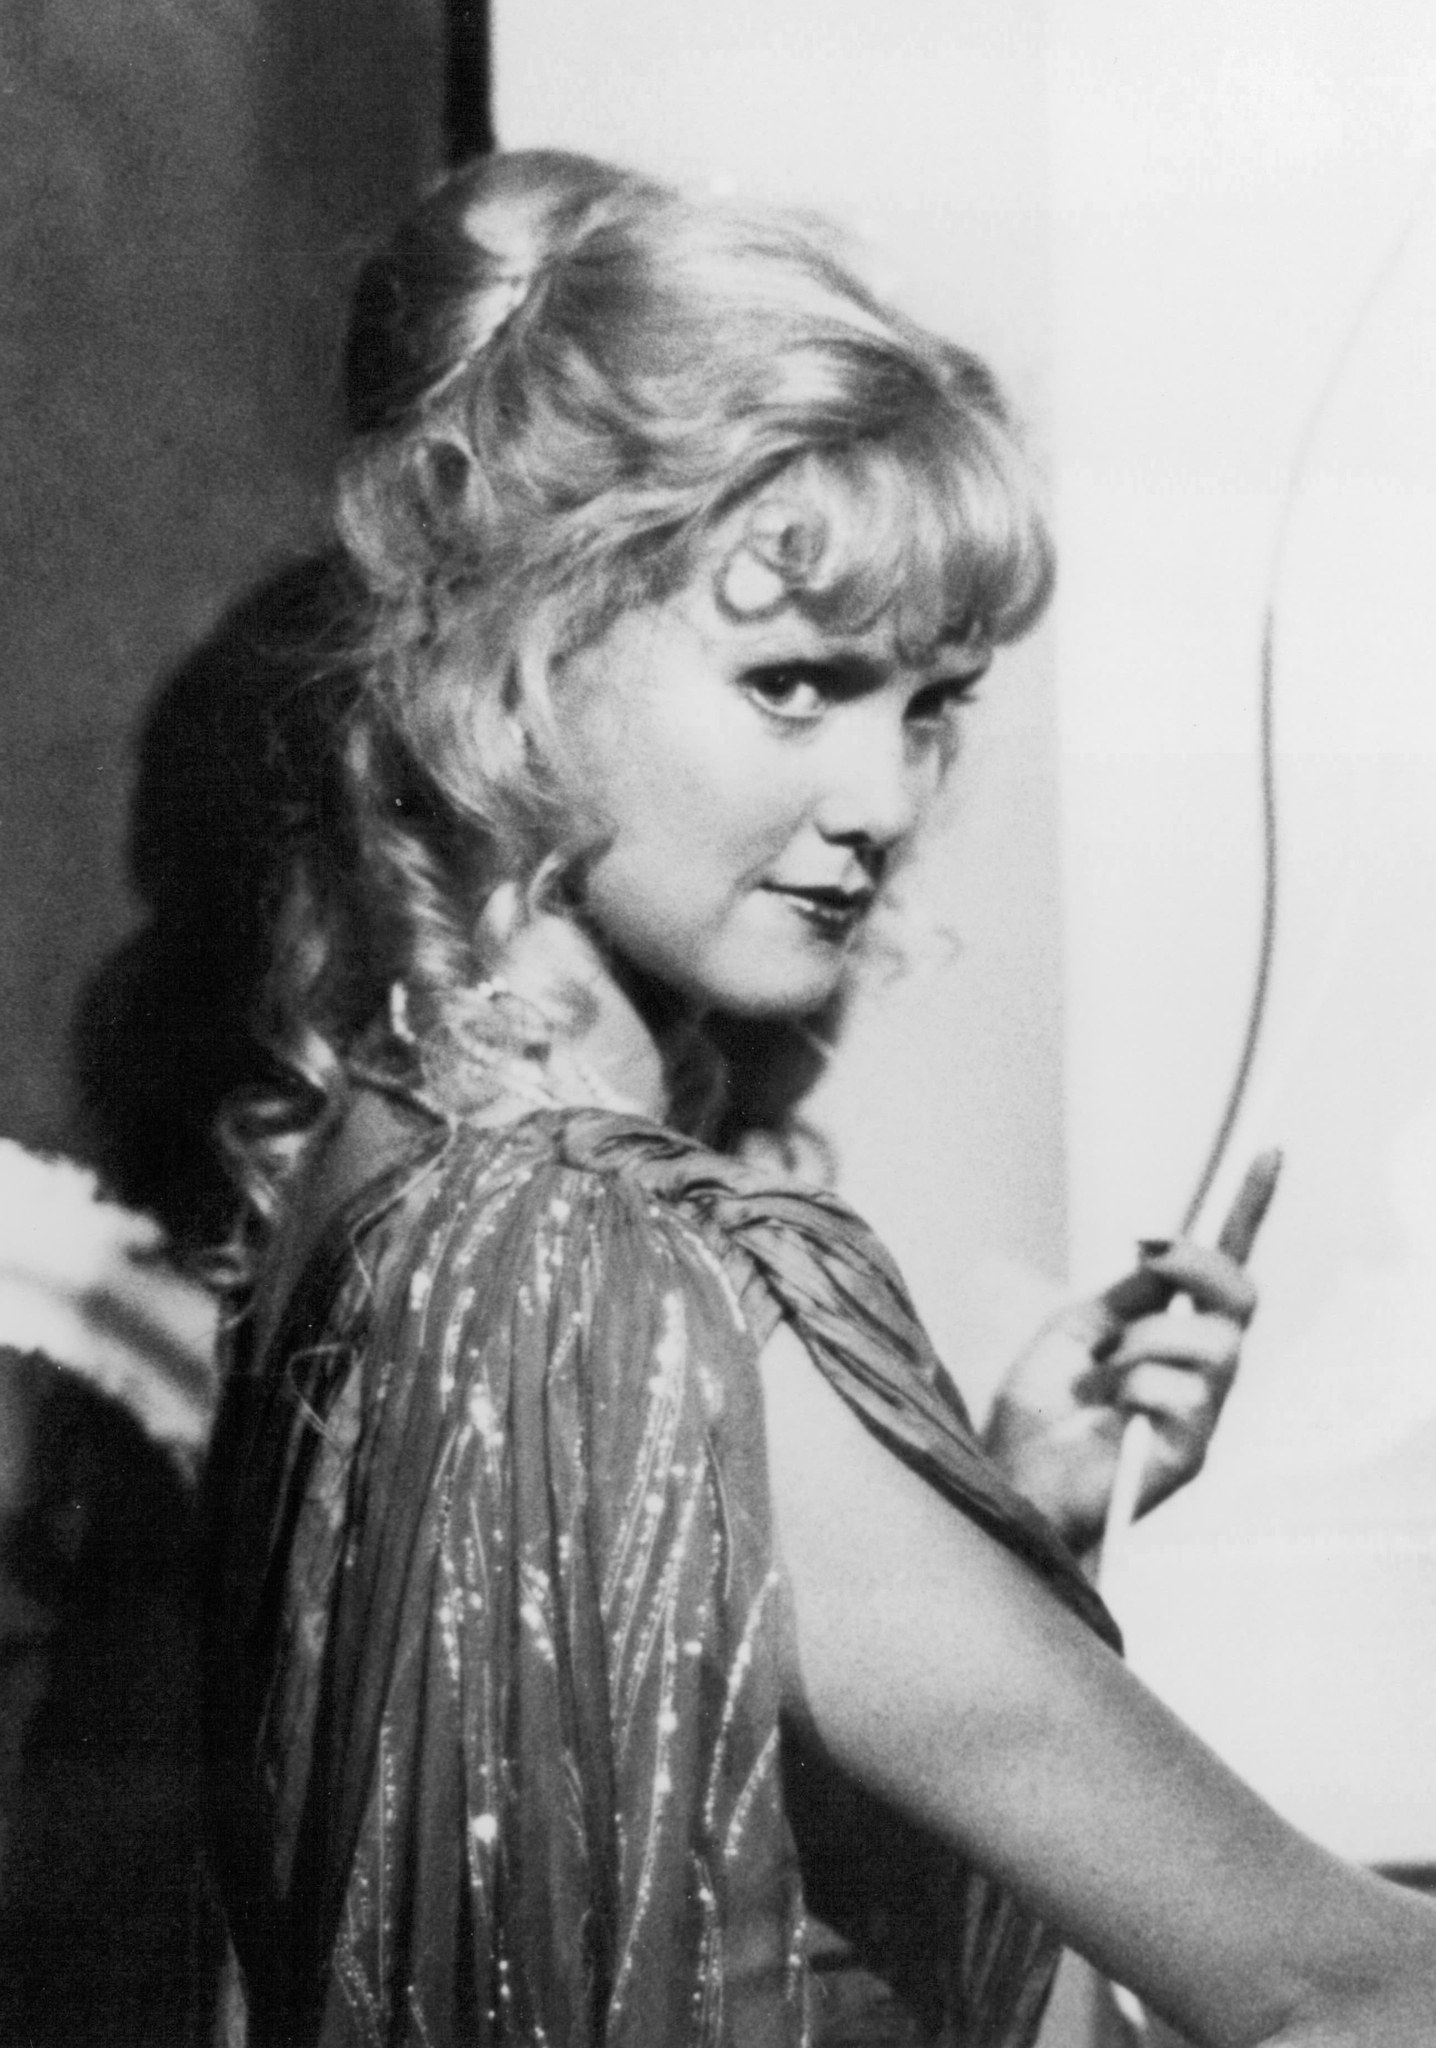
Wendy Lyon
Sally (Secretary)
Box Office Results
Domestic
| Week 1 12/01-12/07 | Week 2 12/08-12/14 | Week 3 12/15-12/21 | Week 4 12/22-12/28 | Week 5 12/29-01/04 | Week 6 01/05-01/11 | Week 7-22 1/12-4/27 |
||||||||||||||||||||||||||||||||
|---|---|---|---|---|---|---|---|---|---|---|---|---|---|---|---|---|---|---|---|---|---|---|---|---|---|---|---|---|---|---|---|---|---|---|---|---|---|---|
| weekend | 166564 | 1141546 | 1710811 | 3000490 | 3530022 | 3139084 | 26626006 | |||||||||||||||||||||||||||||||
| cume | 231008 | 1882564 | 4565665 | 12140155 | 18553464 | 23721892 | 63859435 | 28009047 | 63859435 | 31978745 | 63859435 | 40280050 | 63859435 | 46765691 | 63859435 | 51578714 | 63859435 | 54185844 | 63859435 | 56130069 | 63859435 | 58737483 | 63859435 | 62032982 | 63859435 | 63172500 | 63859435 | 63549054 | 63859435 | 63699028 | 63859435 | 63780344 | 63859435 | 63828652 | 63859435 | 63852985 | 63859435 | 63859435 |
[bsa_pro_ad_space id=13]
| Weekend | Weekly | Locations | |||||
|---|---|---|---|---|---|---|---|
| Week | Gross $ | % Chg. | Gross $ | % Chg. | # | Chg. | Per Theater Average |
| 1 | 12/1/2017-12/7/2017 | $166,564 | - | $231,008 | - | 2 | - | $115,504 |
| 2 | 12/8/2017-12/14/2017 | $1,141,546 | 585.3 % | $1,651,556 | 614.9 % | 41 | 39 | $40,282 |
| 3 | 12/15/2017-12/21/2017 | $1,710,811 | 49.9 % | $2,683,101 | 62.5 % | 158 | 117 | $16,982 |
| 4 | 12/22/2017-12/28/2017 | $3,000,490 | 75.4 % | $7,574,490 | 182.3 % | 726 | 568 | $10,433 |
| 5 | 12/29/2017-1/4/2018 | $3,530,022 | 17.6 % | $6,413,309 | -15.3 % | 756 | 30 | $8,483 |
| 6 | 1/5/2018-1/11/2018 | $3,139,084 | 0 % | $5,168,428 | - | 804 | 0 | $6,428 |
| 7 | 1/12/2018-1/18/2018 | $2,835,459 | -9.7 % | $4,287,155 | -17.1 % | 723 | -81 | $5,930 |
| 8 | 1/19/2018-1/25/2018 | $2,186,311 | -22.9 % | $3,969,698 | -7.4 % | 853 | 130 | $4,654 |
| 9 | 1/26/2018-2/1/2018 | $5,922,553 | 170.9 % | $8,301,305 | 109.1 % | 1,854 | 1,001 | $4,478 |
| 10 | 2/2/2018-2/8/2018 | $4,448,520 | -24.9 % | $6,485,641 | -21.9 % | 2,341 | 487 | $2,770 |
| 11 | 2/9/2018-2/15/2018 | $3,177,255 | -28.6 % | $4,813,023 | -25.8 % | 1,780 | -561 | $2,704 |
| 12 | 2/16/2018-2/22/2018 | $1,660,921 | -47.7 % | $2,607,130 | -45.8 % | 957 | -823 | $2,724 |
| 13 | 2/23/2018-3/1/2018 | $1,311,276 | -21.1 % | $1,944,225 | -25.4 % | 721 | -236 | $2,697 |
| 14 | 3/2/2018-3/8/2018 | $1,479,352 | 12.8 % | $2,607,414 | 34.1 % | 832 | 111 | $3,134 |
| 15 | 3/9/2018-3/15/2018 | $2,347,664 | 58.7 % | $3,295,499 | 26.4 % | 1,552 | 720 | $2,123 |
| 16 | 3/16/2018-3/22/2018 | $793,617 | -66.2 % | $1,139,518 | -65.4 % | 758 | -794 | $1,503 |
| 17 | 3/23/2018-3/29/2018 | $261,997 | -67 % | $376,554 | -67 % | 247 | -511 | $1,525 |
| 18 | 3/30/2018-4/5/2018 | $95,774 | -63.4 % | $149,974 | -60.2 % | 113 | -134 | $1,327 |
| 19 | 4/6/2018-4/12/2018 | $53,458 | -44.2 % | $81,316 | -45.8 % | 80 | -33 | $1,016 |
| 20 | 4/13/2018-4/19/2018 | $34,293 | -35.9 % | $48,308 | -40.6 % | 48 | -32 | $1,006 |
| 21 | 4/20/2018-4/26/2018 | $13,867 | -59.6 % | $24,333 | -49.6 % | 30 | -18 | $811 |
| 22 | 4/27/2018-5/3/2018 | $3,689 | -73.4 % | $6,450 | -73.5 % | 12 | -18 | $538 |
| Total | $63,859,435 | ||||||
Total Includes Full Week Grosses for Weeks 1-22
Worldwide
Box Office Results
| Domestic Total | International Total | Worldwide Total |
|---|---|---|
| $63,859,435 (32.7%) | $131,384,029 (67.3%) | $195,243,464 (100%) |