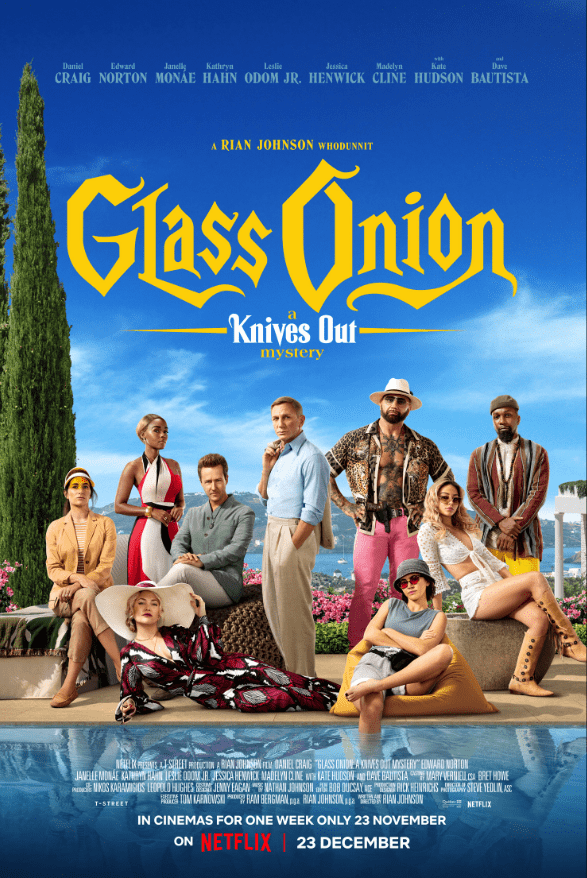
Glass Onion: A Knives Out Mystery (Netflix)

Opened 11/23/2022 | Theatrical • Moderate (696 locations)
Technical Specs: Scope (2.39 : 1), Dolby Atmos, Dolby Digital
Famed Southern detective Benoit Blanc travels to Greece for his latest case.
Director & Top Cast


Box Office Results
Domestic
| Week 1 11/18-11/24 | Week 2 11/25-12/01 |
|
|---|---|---|
| weekend | 0 | 9400000 |
| cume | 3880000 | 13280000 |
[bsa_pro_ad_space id=13]
| Weekend | Weekly | Locations | |||||
|---|---|---|---|---|---|---|---|
| Week | Gross $ | % Chg. | Gross $ | % Chg. | # | Chg. | Per Theater Average |
| 1 | 11/18/2022-11/24/2022 | $0 | - | $3,880,000 | - | 696 | - | $5,575 |
| 2 | 11/25/2022-12/1/2022 | $9,400,000 | 0 % | $9,400,000 | 142.3 % | 696 | 0 | $13,506 |
| Total | $13,280,000 | ||||||
Total Includes Full Week Grosses for Weeks 1-2